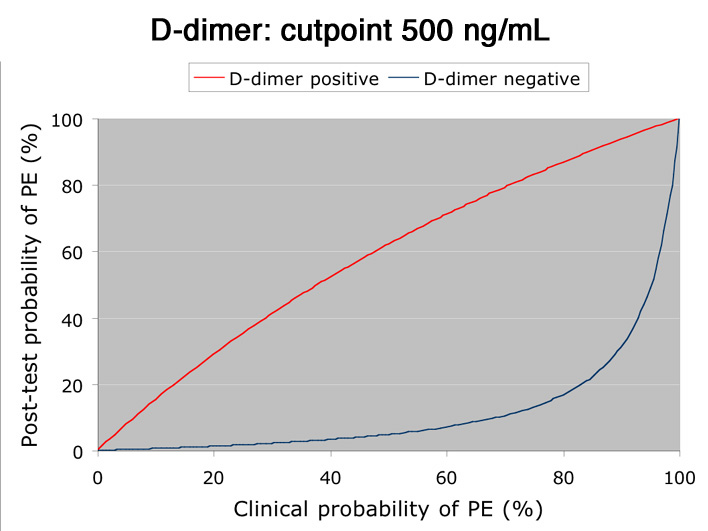
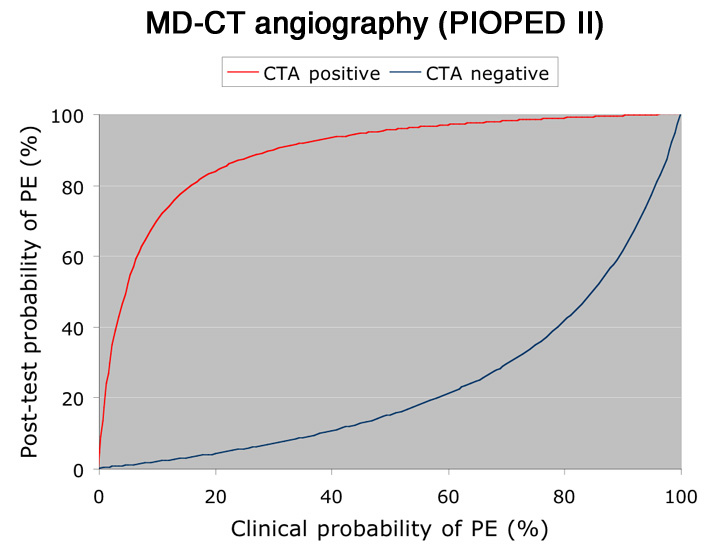
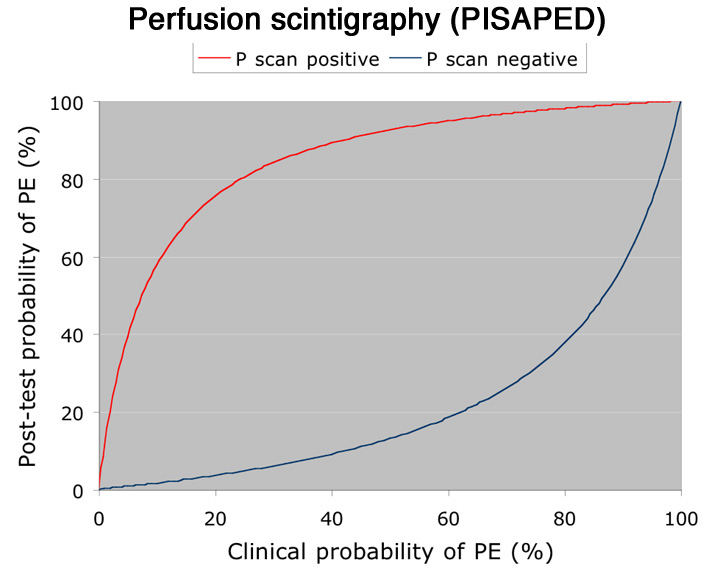
The clinical probability predicted by pisamodels can be used by the physicians as the pretest probability in calculating the post-test probability of pulmonary embolism after appropriate objective testing.
Examples are given in Figures a through c which show the relationship between pretest probability and post-test probability of pulmonary embolism conditioned by the results of (a) quantitative D-dimer test, (b) computed tomographic angiography (CTA), and (c) perfusion lung scintigraphy.
For D-dimer test, we used a weighted sensitivity of 98% and a weighted specificity of 40% as from a recent review1; for CTA, a sensitivity of 83% and a specificity of 96% as from PIOPED II study2; for perfusion lung scintigraphy, a sensitivity of 86% and a specificity of 93% as from PISAPED study3.
References
1. Stein PD, Fowler SE, Goodman RL, Gottschalk A, Hales CA, Hull RD, Leeper KV, Popovich J, Jr, Quinn DA, Sos TA, Sostman HD, Tapson VF, Wakefield TW, Weg JG, Woodward PK, for the PIOPED II Investigators. Multidetector computed tomography for acute pulmonary embolism. N Engl J Med 2006; 354: 2317-2327.
2. Stein PD, Hull RD, Patel KC, Olson RE, Ghali WA, Brant R, Biel RK, Bharadia V, Kalra NK. D-dimer for the exclusion of acute venous thrombosis and pulmonary embolism. A systematic review. Ann Intern Med 2004; 140: 589-602.
3. Miniati M, Pistolesi M, Marini C, Di Ricco G, Formichi B, Prediletto R, Allescia G, Tonelli L, Sostman HD, Giuntini C. Value of perfusion lung scan in the diagnosis of pulmonary embolism: results of the prospective investigative study of acute pulmonary embolism diagnosis (PISA-PED). Am J Respir Crit Care Med 1996; 154: 1387-1393.
| Examples | ||||||
|